Reporting in Postmate Client (HTML & JSON Reports for API Testing)
Postmate Client automatically generates API test reports after every collection run — making it easy to analyze results, share insights, and integrate with CI/CD pipelines.
You get two report formats out of the box:
- HTML Report → for humans (QA, stakeholders, sharing)
- JSON Report → for machines (CI/CD, automation, dashboards)
No configuration. No flags. Just run your collection and get instant insights.
Why Reporting Matters in API Testing
Good reporting helps you:
- Quickly identify failed API tests
- Share results with non-technical stakeholders
- Integrate test results into CI/CD pipelines
- Track API performance and reliability over time
Postmate Client’s reporting is built into postmate-core, ensuring consistent output across CLI and VS Code.
How Reports Are Generated
After every collection run, Postmate Client produces:
| Report | Best For |
|---|---|
| HTML Report | Sharing, debugging, manual analysis |
| JSON Report | Automation, CI/CD, integrations |
Both reports are generated from the same execution result, ensuring consistent API test reporting across manual and automated workflows.
Accessing Reports
CLI
Reports are automatically saved to: .postmate/reports/ in your project directory:
.postmate/reports/
  my-collection-Dev-2026-02-16T03-46-33.067Z.html
my-collection-Dev-2026-02-16T03-46-33.067Z.json- Open the HTML report in any browser
- Works fully offline (no external dependencies)
If you run the CLI from a parent folder, Postmate automatically resolves the
.postmatedirectory and saves reports to the correct location.
VS Code Extension
After a collection run completes, go to the Run Result panel and click "Open Report" to open the HTML report directly in your browser.
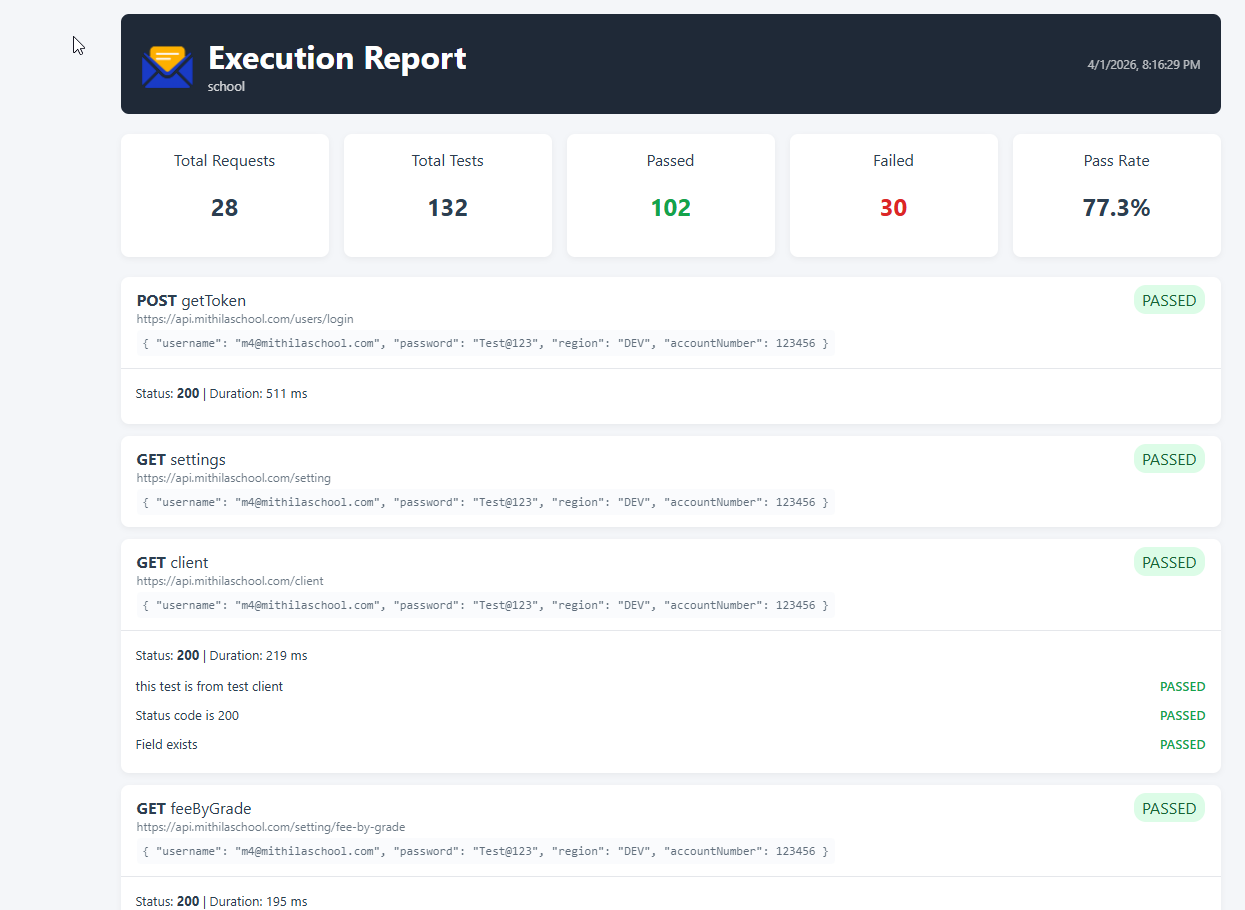
HTML Report (Visual API Test Report)
The HTML report is a fully self-contained file designed for easy sharing and readability.
After running a collection, the HTML report provides a complete visual summary of your API test execution.
Key Features
Key Features
- Execution summary (pass/fail + pass rate)
- Request duration and performance metrics
- Per-request details (status code, response time)
- Test results with pass/fail indicators
- Expandable JSON response data
- Timestamp and environment info
- Embedded assets (no external CSS/JS required)
Perfect for:
- QA teams
- Stakeholder reporting
- Debugging failed API tests
JSON Report (Machine-Readable Output)
The JSON report is designed for automation and integrations.
Output Structure:
{
  "summary": {
    "totalRequests": 10,
    "totalTests": 45,
    "passed": 42,
    "failed": 3,
    "durationMs": 5234
  },
  "requests": [
    {
      "id": "req1",
      "name": "Login",
      "method": "POST",
      "url": "https://api.example.com/login",
      "status": 200,
      "duration": 124,
      "data": {},
      "tests": [
        { "name": "Status is 200", "status": "passed" }
      ]
    }
  ]
}
Common Use Cases
- CI/CD validation pipelines
- GitHub Actions / GitLab CI
- Custom dashboards
- Trend analysis & reporting
- External system integrations
Using Reports in CI/CD Pipelines
Postmate Client reports are CI/CD-friendly by design.
- Upload the HTML report as a build artifact
- Parse the JSON report for automated validation
- Fail pipelines based on test results
See the CLI reference for examples:
Postman Report Alternative
If you're looking for a Postman reporting alternative, Postmate Client provides:
- Built-in HTML reports (no Newman required)
- JSON output for CI/CD pipelines
- Fully offline reporting (no cloud dependency)
- Automatic report generation (no extra setup)
Unlike Postman, you don’t need additional tools or plugins to generate and share reports.